WEEKLY ANALYSIS AND TRADE SETUP- 2 APRIL 2017
Page 1 of 1

WEEKLY ANALYSIS AND TRADE SETUP- 2 APRIL 2017
![]() by AVINASH Sun Apr 02, 2017 2:13 pm
by AVINASH Sun Apr 02, 2017 2:13 pm
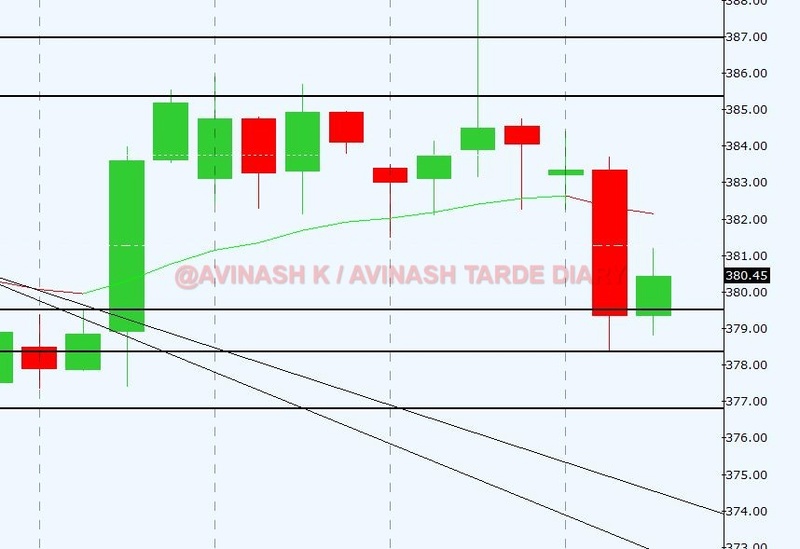
Last weekly analysis mentioned about 378 level which offered support to falling price,
as on 27 March , daily candle made low of 370.25 but closed above 378, and after this prices zoomed till 389 odd.
This price movement broken trend line on 240 which is our basis to initiate long trade in copper, which is we holding at present.
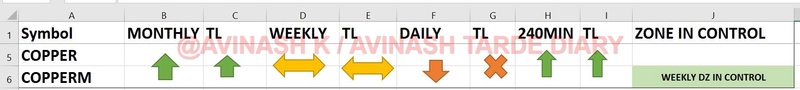
Trend on monthly is up with sideways on weekly. Though trend on weekly is down but trend line is broken and on 240 min trend has changed from down to up with intact trend line.
Hence we initiated long trade.
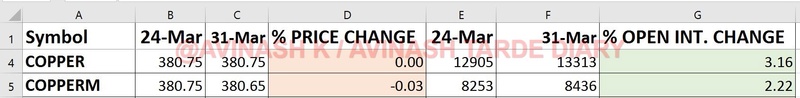
OI analysis suggesting some sideways movement.
Trend Analysis:
OI Data Analysis:
Trade Setup:
as on 27 March , daily candle made low of 370.25 but closed above 378, and after this prices zoomed till 389 odd.
This price movement broken trend line on 240 which is our basis to initiate long trade in copper, which is we holding at present.
Trend on monthly is up with sideways on weekly. Though trend on weekly is down but trend line is broken and on 240 min trend has changed from down to up with intact trend line.
Hence we initiated long trade.
OI analysis suggesting some sideways movement.
Trend Analysis:
OI Data Analysis:
Trade Setup:

AVINASH- Admin
- Posts : 165
Join date : 2017-03-04
Location : MUMBAI -

Page 1 of 1
Permissions in this forum:
You cannot reply to topics in this forum